China boasts the largest afforestation rate in the world, so why aren’t these forests showing up on satellite images…
The prodigious economic growth of China has produce some mind-boggling statistics: a new airport every day, a new power station every hour, a new motorway every minute (OK, perhaps a slight exaggeration but you know what I mean). The same is true with forest cover, or so I thought…
Nearly a decade ago, the FAO Global Forest Resources Assessment (FRA) reported for forest cover in Asia
“…a net gain of 1 million hectares per year from 2000 to 2005, primarily as a result of large-scale afforestation reported by China”
Fig 5 in the FRA showed China as an island of green in a sea of red, indicating a large net positive change in forest cover of around 4 million ha per year from 2000-05.

China reported no change in primary forest area between 1990-2005 (at 11.6 Mha), but plantations increased from 18.5 to 31.4 Mha. This massive afforestation resulted in near zero change in forest area for Asia as a whole between 1990-2005, at around 570 Mha, largely offsetting deforestation across the region.
The FRA 2010 doubled the rate of forest area growth in Asia, stating
“Asia … reported a net gain of forest of more than 2.2 million hectares per year in the period 2000–2010, primarily due to the large-scale afforestation reported by China and despite continued high rates of net loss in many countries in South and Southeast Asia.”
The annual net gain in forest area reported by FRA 2010 for China was 2.0 Mha per year from 1990 to 2000, 3.2 Mha per year for 2000 to 2005, and 2.8 Mha per year from 2005 to 2010.
Speak to most forest scientists about the FRA data and they’ll tell you that, while the data are likely to be full of errors and biases (because they’re reported by countries, rather than being independently assessed), they’re the only estimates we have so we may as well use them. Certainly, many influential papers have made use of the FRA data.
For example, Pan et al. (2011), cited 621 times to date according to Google, estimated a near-doubling of China’s biomass carbon sink between 1990-99 and 2000-07, from 60 Tg Carbon per year to 115 Tg C per year. In contrast, the USA sink increased from 118 to 147 Tg C per year over the same period. The Supplementary Online Materials state that national forest inventories were used for estimating changes in China’s forest biomass, and for the USA, Canada, Russia, and some others. FRA data were used for Europe, Africa, and the Americas, while remote sensing estimates of forest area change were only available for Australia and New Zealand. The estimates of afforestation in China were even greater in Pan et al. than in the FRA 2010: more than 4 Mha per year, i.e. larger than the combined total forest area gain for the top ten countries (including China) by gain listed in FRA 2010. To put this final estimate into the proper perspective, annual afforestation in China, as listed by Pan et al., is twice the Size of Wales.

As mentioned, while FRA data may have been flawed, for many years they were the only game in town. The situation has started to change with the availability of cheap, global, satellite-derived land cover data. Last year, researchers from the University of Maryland, working with Google, published a comprehensive analysis of Landsat data in Science. This analysis classified every 30 x 30 m pixel of the Earth’s surface by forest cover between 2000 and 2012, allowing deforestation, afforestation and reforestation to be estimated at unprecedented spatial and temporal resolution.
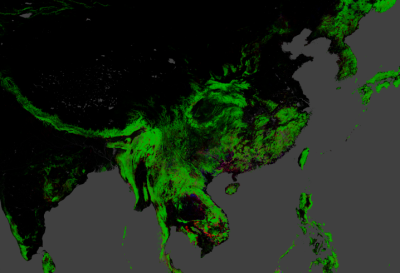
The maps are fascinating to browse, with each pixel coloured by default with green (forest), red (deforestation), blue (afforestation), magenta (deforestation and reforestation within the study period), or black (no forest). Large areas of forest loss in the boreal regions of Canada, Alaska, and Russia, and in southern Brazil, immediately stand out. The lack of blue in China also piques the interest…
Hansen et al. (2013) make little mention of China in their article, stating only that
“Areas of colocated loss and gain (magenta tones in Fig. 1D), indicating intensive forestry practices, are found on all continents within the subtropical climate domain, including… southern China…”

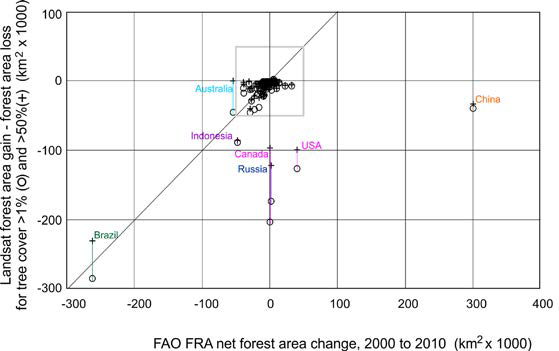
Wait a minute, that can’t be right? Surely, with up to 4 million hectares of new forest every year, China should be bright blue? Delving once again into the extensive Supplementary Online Materials, we find that Hansen et al. have made the all-important comparison with the FRA data. And on page 9, Fig. S3, a SHOCKING DISCOVERY: China’s forest cover has actually shrunk! Rather than growing by 30 Mha between 2000 and 2010, the area of forest estimated by the Landsat analysis decreased by around 3 Mha. In addition, the USA, Canada and Russia (i.e. the world’s most-forested nations) have also lost huge areas of forest which were unreported in the FRA.

Before everyone says “well we told you the FRA data were unreliable”, the figures for many other (less forested) countries are reasonably accurate, as are those for Brazil. (The difference between the crosses and circles in Fig. S3 aren’t described in the SOM, perhaps they refer to different dates?).
Hansen et al. are sanguine about the differences between their findings and the FRA (and therefore, National Inventory) data:
“the large amount of tree cover change observed in satellite imagery in Canada and the USA does not conform to the land use definitions applied in the FRA for these countries. While there is significant forest change from a biophysical perspective (i.e., forest cover), there is little or no land use change, the main criterion used in the FRA report. Additionally, China, and to a lesser extent India, report significant forest gains that are not readily observable in time-series satellite imagery, including this analysis”
So, for Canada and the USA, the definition of what is, and is not, a forest appears to be to blame, i.e. if an area is felled or burned, it is still counted as forest because, in the fullness of time, the trees will grow back and the successional cycle of forest regeneration continues. However, the implications for estimates of the forest biomass carbon sink could be severe, if the additional loss of forest outweighs growth rates of remaining forest. Pan et al. (2011) listed boreal Russia and Canada has having roughly constant forest cover from 1990 to 2007, which would introduce a large bias into estimates of carbon storage, if, in reality, millions of hectares had been lost.
For China, the mystery of the missing forests is harder to explain. It could be that the newly-planted trees haven’t grown large enough to be detectable, but, if that were the case, why would new forests in other parts of the world be detectable by Hansen’s methodology? The Wikipedia article on the “Three-North Shelter Forest“, an afforestation project designed to hold back the expansion of the Gobi desert, lists problems such as huge early losses of planted trees through drought, storms, pollution, and disease. In 2000, one billion poplars were lost to the cerambycid beetle Anoplophora. So, it could be that, though much forest has been planted, very little has survived to be surveyed by Landsat.
The story of China’s missing forests continues. A paper published by Chinese researchers in PNAS in February this year states that afforestation in China affects local climate. Peng et al. (2014) obtained data on the distributions of planted forests from the national inventory, and Hansen et al. (2013) is not cited. Nevertheless, a significant decrease in daytime land surface temperature and an increase in night time temperature due to afforestation was detected.
As nearly everyone expected, there are differences between FRA (and national inventory) estimates of forest cover and change. What I did not expect was the size of the discrepancy for the World’s most forested countries, and the implications this could have for estimates of the terrestrial carbon sink. Clearly, analysis of remote sensing data will continue and these discrepancies will slowly be resolved.
References
Hansen, M.C., Potapov, P.V., Moore, R., Hancher, M., Turubanova, S.A., Tyukavina, A., Thau, D., Stehman, S.V., Goetz, S.J., Loveland, T.R., Kommareddy, A., Egorov, A., Chini, L., Justice, C.O. & Townshend, J.R.G. (2013) High-Resolution Global Maps of 21st-Century Forest Cover Change. Science, 342, 850–853. doi: 10.1126/science.1244693
Pan, Y., Birdsey, R.A., Fang, J., Houghton, R., Kauppi, P.E., Kurz, W.A., Phillips, O.L., Shvidenko, A., Lewis, S.L., Canadell, J.G., Ciais, P., Jackson, R.B., Pacala, S.W., McGuire, A.D., Piao, S., Rautiainen, A., Sitch, S. & Hayes, D. (2011) A Large and Persistent Carbon Sink in the World’s Forests. Science, 333, 988–993. doi: 10.1126/science.1201609
Peng, S.-S., Piao, S., Zeng, Z., Ciais, P., Zhou, L., Li, L.Z.X., Myneni, R.B., Yin, Y. & Zeng, H. (2014) Afforestation in China cools local land surface temperature. Proceedings of the National Academy of Sciences, 111, 2915–2919. doi: 10.1073/pnas.1315126111

The situation in China is likely to be a pretty complex mix of all the things listed: large losses due to drought, pest outbreaks, definitions of forest etc.
A lot of the planting seems to be taking place in fairly arid areas, using non-native species that may not very well suited to conditions. However the one paper I know of that acknowledges these problems suggests that tree cover has still increased in these areas (http://onlinelibrary.wiley.com/doi/10.1111/j.1365-2664.2008.01605.x/abstract).
I also wonder about how much of this is down to corruption. China doesn’t exactly have the most transparent government in the world (evidence:http://www.transparency.org/country#CHN_DataResearch) and I wouldn’t be surprised if some of the money had been siphoned off by some officials somewhere.
Would be interested to see what other people’s theories on this are.